How to Export Power BI Data to Excel (Step-by-Step)
Every user needs to export data from Power BI to Excel to further analyze, manipulate or share data out to Power BI’s environment 🧐
Power BI offers easy data exporting to other software like Excel. You can share the exported file with your team, and colleagues and examine it in detail.
Whether you’re working with visualizations, raw data or large files, exporting data from Power BI To Excel is an easy task. It takes less than two clicks and the process is intuitive 🤩
In this tutorial, we will see an easy way how to export Power BI Data to Excel. Let’s get started.
Export data from a dashboard
Exporting data from a dashboard in Power BI is very simple. Dashboards have everything stored in one place for a one-glance view.
You can select any visualization from the dashboard and download the data it contains in a separate .csv file.
Let’s say we want to download the data behind this visual and export it to Excel.
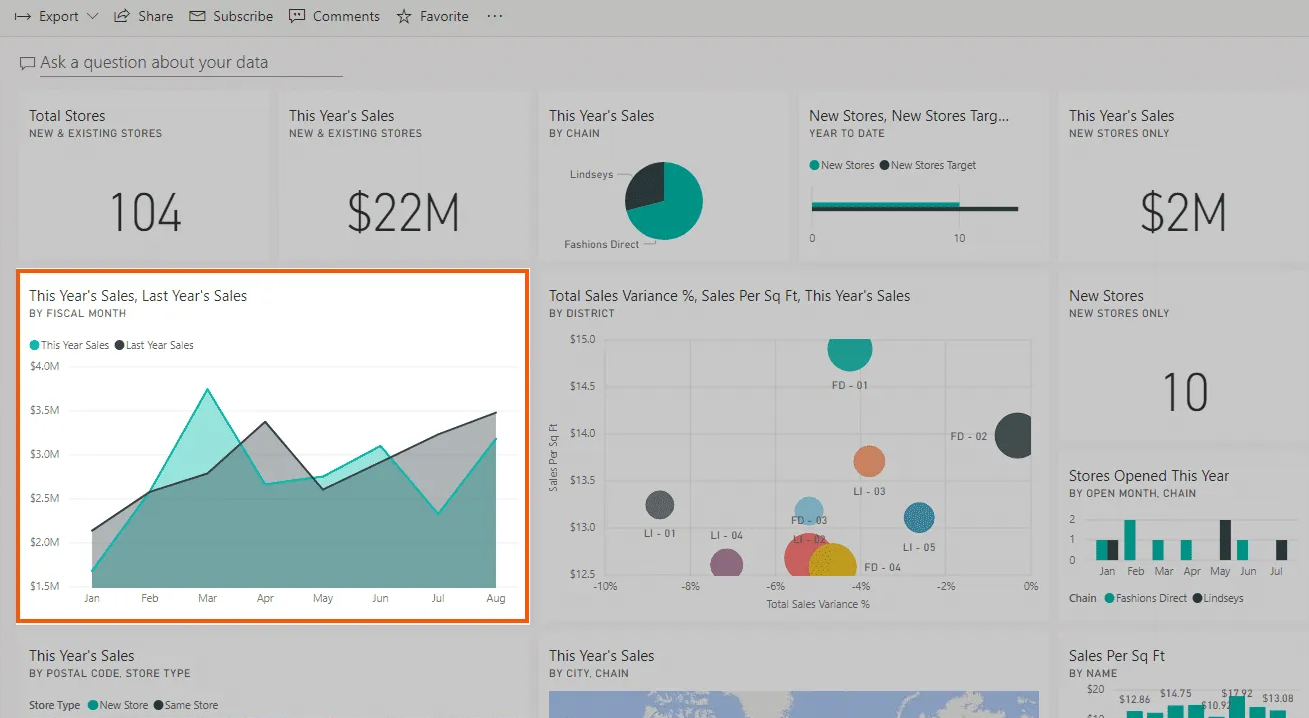
To do that,
Step 1) Select the visual.
Step 2) On the upper right corner of the visual, click on the three dots.
Step 3) Select Export to .csv from the dropdown list that appears.

The browser will begin downloading the file in the background and once downloaded, it will save it on your local hard disk in the downloads folder 📁
If you had filters applied to the visualizations, the exported report would appear with the same filters.
If the report contains a sensitivity label whose tile you’re downloading, Excel will show a sensitivity label prompt. In this case, it is better to rethink if exporting this file is necessary and if it is, go to the original report with the visual and make an export copy from there.
Step 1) Open the .csv file in Excel by going to the Data tab from the ribbon.
Step 2) Select the Get Data option from the Get & Transform section.
Step 3) Select choose from File from the options and select from Text/CSV.
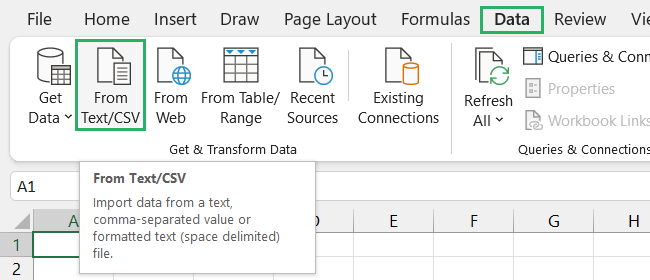
Step 4) From the dialogue box that appears, select the file.
It will load into Excel in no time.
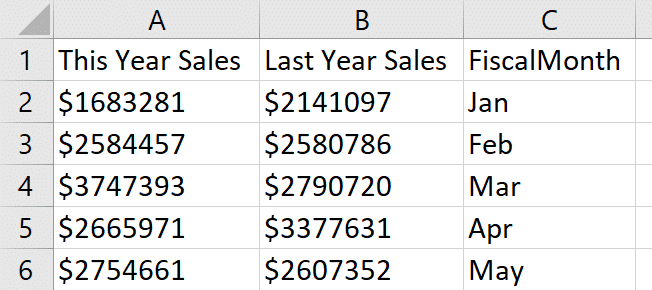
And you can now make all the changes that you want. Cool, right? 😉
Export data from a report
People often get confused about the difference between a report and a dashboard. Keep this key difference in mind – a dashboard is a single page with visualizations whereas a report has multiple pages with visualizations, tables and matrices.
Exporting data from a report is relatively difficult compared to exporting it from a dashboard but worry not – we’ll cover everything in detail.
Since reports are easier to create and manage in Power BI Desktop, we will see how to export data from reports in Desktop and Service.
Export from Desktop
Say, you want to export a visual dataset from the report in Desktop 💻
To do that,
Step 1) Click on the visual you want to export.
Step 2) Select the three dots and click on Export data option.

Step 3) The Save as dialogue box will appear, select a location and press Save.
And it’s done! The data has been exported.

Open the .csv file in Excel and enjoy!
Export from Service
Exporting from service takes slightly more time and filling more options but it gives you complete control on what you are exporting and how.
Say, we want to Export the dataset behind the following visual.
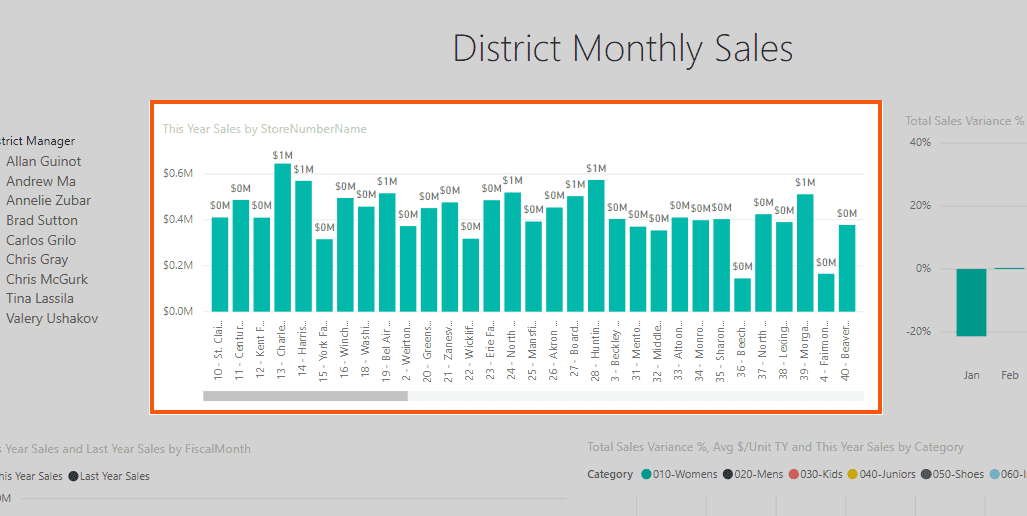
To do that,
Step 1) Click on the visual you want to export.
Step 2) Select the three dots and click on the Export option.

Excel will now show a prompt on the screen asking which data would you like to export and in which format 🎨
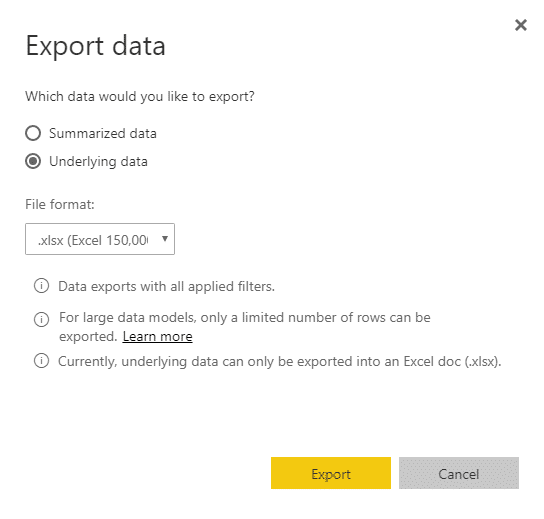
Let’s see what to do with it below.
Summarized Data
Select this option if you only want to export the data you see in the visual. You will see the measure and columns used to create the visual only. If you have any filters applied to the visual, the filters will be copied to the export file as well 📃
For File Format, you need to know the number of rows you want to export. You have three options:
.csv file (exports 30,000 rows only)
.xlsx file (exports 150,000 rows only)
.xlsx file with live connections (exports 500,000 rows only)
The .xlsx options support sensitivity labels whereas .csv doesn’t.
Underlying Data
Select this option when you want to see all the underlying data of the semantic model of the visual. It shows the same data filters in the export file that were applied to the visual.
Note that if you have any functions applied to the data like count or aggregate, the underlying data would remove the function and you would get raw, flattened data.
In some cases, the data you’re trying to export has its underlying data disabled. This happens when you don’t have build permissions to see the whole of the data. These permissions are put in place to protect the data from unauthorized view or access – to override this, you need the owner’s consent 🤫
Once you select Export, the browser will start downloading the export file in the background. Once downloaded, it will appear in your Downloads folder.
Open the exported file in Excel and you can now make all the changes you want.
Copying tables into Excel
One of the major differences between the Power BI Desktop and Service is the data view you only get in the Desktop version. For this method, we will be using the data view of Desktop since we will be copying tables from the data view.
We will use the same data set as earlier.
To do that,
Step 1) On the left-hand sidebar, select the table icon to open the data view.
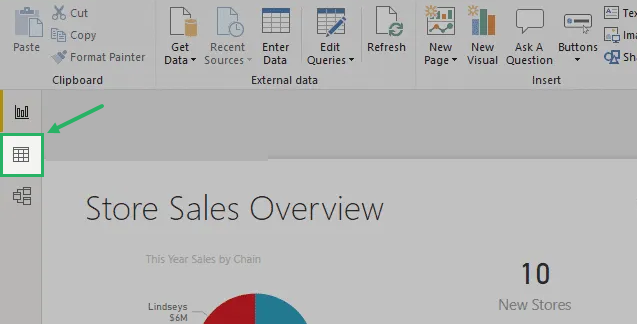
A table will appear on the sheet with the Fields pane activated on the right side 📅
Step 2) From the fields pane, select the specific table by clicking its name.
This will also list out the sub-tables under that table’s name. If you don’t want to see the sub-tables, you can hide them by clicking the down arrow next to the parent table’s name.
Step 3) Right-click the table you want to copy and select Copy Table from the dropdown list

Step 4) Open Excel, select cell A1 and paste the data thereby pressing CTRL + V.
This will copy the entire data set along with the DAX-calculated columns.
And it’s done! You can now explore and analyze your data further as you want.
Exporting data using the Analyze in Excel feature
Analyze in Excel feature is yet another easy way to export data from Power BI to Excel. The tool instantly takes you to Excel for a glance at the data set.
To use it,
Step 1) Load the data into Power BI.
Step 2) Click the Export button next to the Home button in the left sidebar.
Step 3) Select Analyze to Excel from the dropdown.

This will take you to Excel’s web version to view the data. You can get a copy of the data set from there in .xlsx or .csv form 📃
Sounds good? But there’s a drawback. It only shows summarized data – the one in the visual. This deprives you of access to the entire raw data set.
But it’s there if you want to use it. However, if you have organizational restrictions, the option might be disabled. For that, you will need the organization’s approval.
Limitations
When exporting data from Power BI to Excel, there are some considerations and limitations you need to keep in mind for both Power BI Desktop and Service in both Pro and premium plans 💲
Let’s see a summary of these limitations below:
- The maximum amount of data that Power BI can export is 16MB of uncompressed data.
- To export data from a data set’s visual, you need to have build permissions for that dataset.
- Some data might not display properly in Excel, especially Unicode characters.
- Your version should be older than 2016 and tables in the data model should not have any unique key when exporting underlying data.
- If you have renamed a file in Power BI, it is possible Excel uses the original name of the file.
- If there’s no relationship between the data, only one table can be exported even if the data is originally from different sources.
- The data export feature in Power BI can be disabled by the Administrator.
- Data can’t be exported from R and custom visuals.
- If the admin has disabled the export feature, you can’t export underlying data. If the ‘Show items with no data’ is turned on for a certain visualization, you won’t be able to export data from there either.
Conclusion
Exporting data from Power BI to Excel is a straightforward process that allows users to analyze and examine their data in a more flexible environment 😃
However, it does have some limitations that you need to keep in mind when exporting data. The process is even easier if you are the owner of the file – if you are a consumer, you will have to contact the owner to set export permissions.
To learn more about Power BI and Excel, give the following articles a read:
Power BI vs Excel: When to Use Excel and When Power BI Is Better
How to Do Table Visualization in Power BI (Step-By-Step)
How to Visualize Data in a Matrix in Power BI (Easy Guide)
We hope you enjoy reading these articles as much as we did crafting them! 🤗
