How to Create a Hierarchy in Power BI
Hierarchies in Power BI are essential for organizing and visualizing data in a structured manner. They let you traverse through the complexities and different levels of your dataset effortlessly.
You can use hierarchies to drill down from general categories to specific items in your dataset. Creating hierarchies enables a more streamlined process, & a highly intuitive experience for users.
By default, Power BI detects your data and organizes the data hierarchy automatically. But what if you want to create your hierarchy? Luckily, Power BI allows you to do that
In this tutorial, we will see how to create a hierarchy in Power BI and change its levels. Let’s begin!
What is Power BI Hierarchy?
Hierarchy is s system where one element is ranked over the other in a hierarchical manner – similar to that of a tree 🌳
It shows the data in a structured way that lets you drill down from an overview of data to lower levels in a very particular way.
One of the most common hierarchies in Power BI is that of date and time. It goes like YEar > Month > Week > Day and you can even go on to show the time.
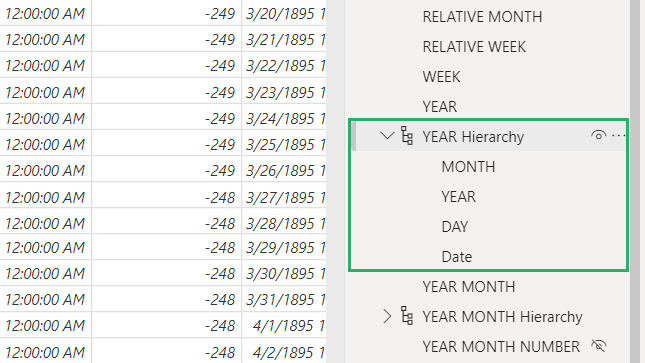
Hierarchies in Power BI appear with a bright golden hierarchy icon so they’re easy to spot. You can create a hierarchy of almost anything that follows an order of data.
For instance, you can create a hierarchy of towns that have branches of a certain company – something like Country > Cities > Towns. You can map this to any information you want.
Hierarchies are important in Power BI because they allow you to filter your visual and reveal all small, otherwise hidden details of your data set 🤫
Power BI allows you to customize the hierarchies as you like with different levels and amounts of data in each level so you can explore your data in depth.
Create a Hierarchy in Power BI
Despite common perception, creating a hierarchy in Power BI is one of the easiest tasks. You can create in only a few clicks depending on the number of levels you want to insert.
It’s preferred to create a hierarchy in Power BI Desktop instead of Service because in the latter you can’t access the data easily and make changes to it – the desktop version offers this ease of use 😃
We will be using the Retail Analysis Sample dataset for this example.
We want to form our hierarchy as follows:
- Year
- Quarter
- Month
- Day
Year is our top-level element here such that Year > Quarter > Month > Day.
To create a hierarchy in Power BI,
Step 1) Go to the Data view on your Desktop.

This is where we’ll be creating our hierarchy.
Step 2) Select the top-level hierarchy – Year in this case.
Step 3) Right-click it and select Create Hierarchy from the dropdown list.
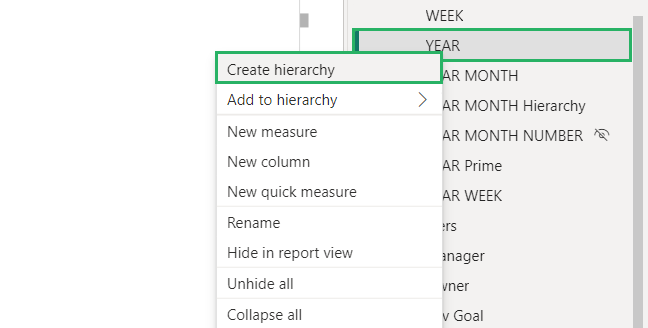
And it’s done! You just created a new hierarchy named Year Hierarchy.
Step 4) Select and drag the columns you want to add to the hierarchy – like Month and Day.
Step 5) Or you can right-click them select “Add to Hierarchy” and select the name of Hierarchy.
All the newly inserted columns will appear under the Year hierarchy as:

And it’s done! 😀
Modifying levels of Hierarchy in Power BI
You can modify levels of hierarchy in Power BI to refine and improve your data model as desired. You can add a level, delete it and reorder it. Let’s see how to do this below.
Add New Levels
If you want to add another level to your hierarchy, this is all you need to know.
To add another level,
Step 1) Select the field you want to add as a level.
Step 2) Right-click it and select “Add to hierarchy” from the dropdown and select the hierarchy to add to.
This would add the field selected at the bottom of the selected hierarchy.
For instance, to add the field Date to the Year hierarchy:
Step 3) Right click the Date field.
Step 4) Select Add to YEAR hierarchy from the dropdown list.
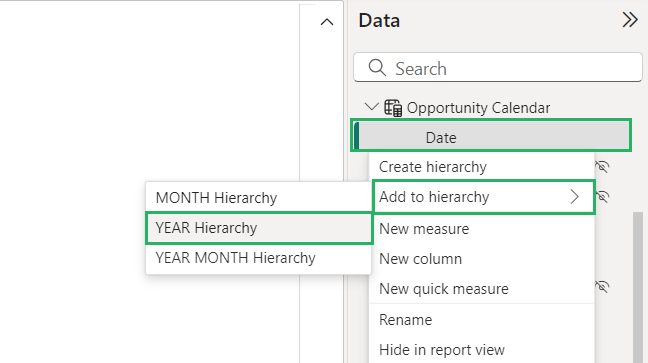
And it appears in the selected hierarchy as:

Similarly, you can add multiple other fields in the Report view in the same way 🧐
Remove a Level
Removing a level is just as easy as adding one. You can delete the level from both the Report view and Model view. Let’s see both of these below.
To remove from the Report view,
Step 1) Right click the field you want to remove from the hierarchy – say Month.
Step 2) Select Delete from Model from the dropdown list.
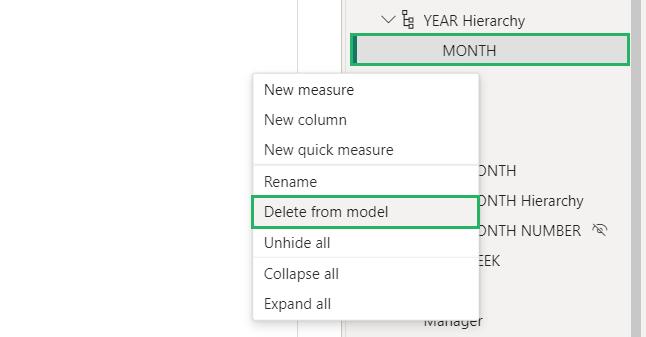
The selected field will be deleted as:
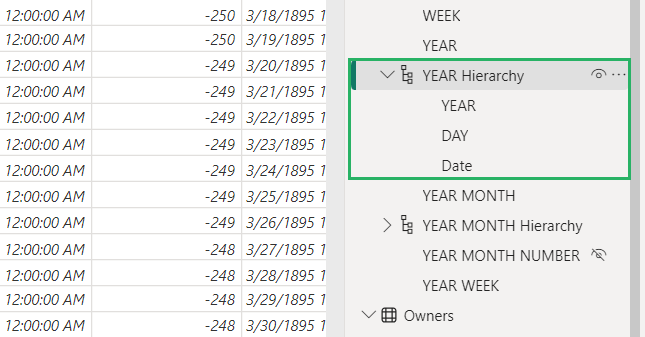
The Report view method is quick but it often results in mistakenly deleting the original field instead of deleting it from the hierarchy.
To remove from the Model view,
Step 1) Select the name of the hierarchy to activate it.
Step 2) From its sub-sections, press the cross button on the field you want to remove.
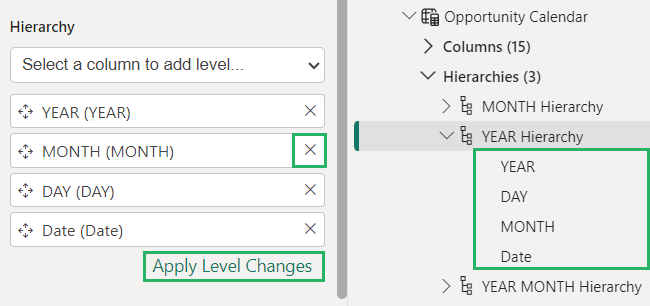
And it’s gone! Make sure to press the “Apply Level Changes” button once you’re done or the changes won’t be saved.
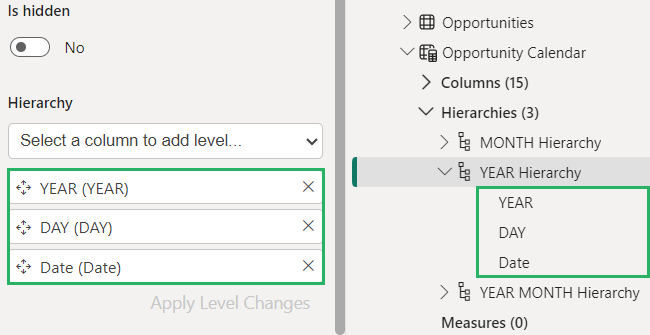
This method is better than the Report view as the choice of deletion is more deliberate 🤠
Reorder Level
Report view does not offer the feature to reorder levels in a hierarchy – to organize it you will have to delete the entire hierarchy and create it from scratch 🔪
To avoid this, we reorder the level from the Model view in Power BI. You simply need to drag the fields in whatever order you want and it’s done.
Step 1) Select and drag the field you want to reorder or right-click it and select Move up or down.
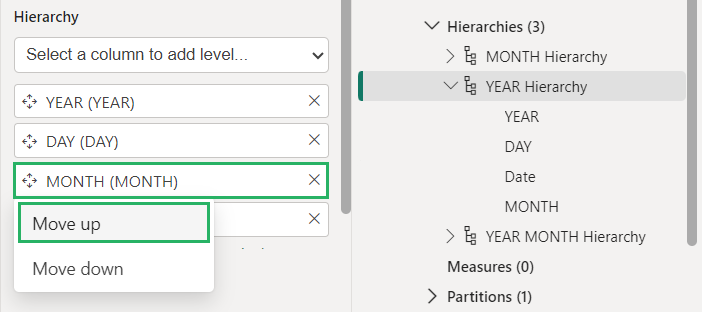
Step 2) Press the Apply Level Changes button.
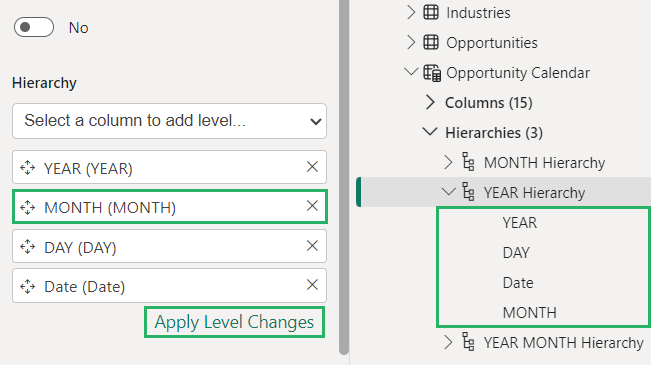
And it’s done! The hierarchy has been reordered 😀
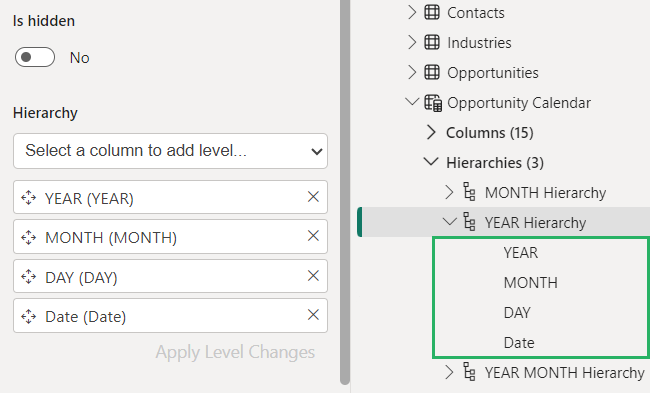
How cool is that? Try it now!
Rename a Level
You can rename the hierarchy to set a new name.
Step 1) Right click the top element of the hierarchy.
Step 2) Select Rename from the dropdown list.

Step 3) Enter the new name of the hierarchy.
Step 4) Press Enter.
And it’s done! Your hierarchy is all created.

That wasn’t difficult, was it? 😃
Delete Hierarchy
Deleting a hierarchy is similar to deleting individual fields from it.
To delete a hierarchy,
Step 1) Right-click the name of the hierarchy.
Step 2) Select Delete from Model from the dropdown.

And poof!
It’s gone. How easy was that? 😎
Limitations of Power BI Hierarchy
Hierarchy is an essential tool of Power BI and works wonderfully but it has its fair share of limitations. Let’s see these below.
- You can create more than ten different levels in a hierarchy but having anywhere more than five is not practical and difficult to manage.
- Hierarchies are not compatible will all types of visuals. It might work slowly or not at all on some advanced visuals.
- Hierarchies are not very good at handling large datasets. It can make your system slow.
Conclusion
Creating a hierarchy in Power BI is one of the simplest tasks. You need no technical knowledge for it, just a good know-how of your dataset 😉
Organizing your data into structured levels lets you drill down from its high-level overview to detailed insights which helps uncover trends and patterns easily.
The hierarchical structure not only improves the clarity of your report but also makes it more interactive and easy to understand.
To learn more about Power BI and hierarchy, give the following articles a read:
Power BI Dashboard vs. Report: The Pros and Cons
How to Create Groups in Power BI: Get an Overview of Your Data
How to Visualize Data in a Matrix in Power BI (Easy Guide)
We hope you enjoyed reading this article as much as we did! Happy Analyzing! 🤗
