How to Insert an Image in Power BI
Images play an important role in visualizing your words. They become even more important when used in Power BI reports and help enhance the overall effectiveness 😀
Whether it’s a company logo you want to add, content via URLs, or background visuals, adding images can provide additional context and add to the visual appeal.
In this tutorial, we will see different ways you can insert an image in Power BI. Download our sample workbook here to practice along the guide.
Images in Power BI
Adding images in Power BI is as easy as opening a document – all you need to do is press a button. You can choose to add images directly, as part of a card, or table, or with image URLs as you like.
Power BI lets you add images in visuals and personalize them too. This might seem a little complicated at first but once you get a hang of it, you will realize it’s very simple 🧐
You can insert images, add different elements to them, set them as background, insert with URLs, and a lot more. Let’s learn all this and more in this article.
Adding images to Power BI reports
Images can easily be added to Power BI Reports whether it’s adding the graphic as a visual or a background. All details on it are below.
Adding Image as a Visual
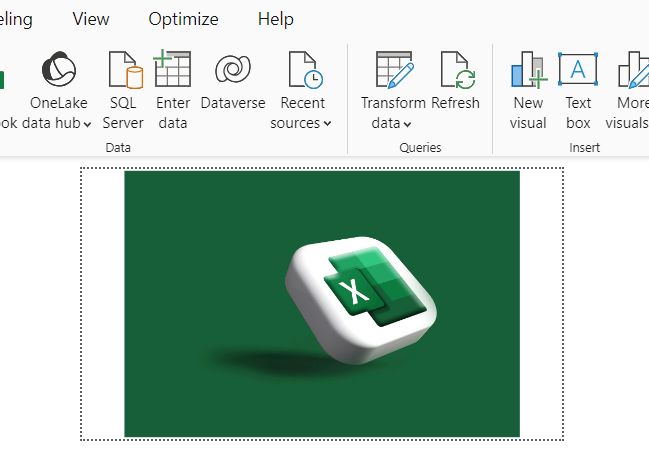
We want to add the following image to our Power BI report 📃

To do that,
Step 1) Open your report where you want to insert the image.
Step 2) Navigate to the Insert tab on the ribbon and select Image from the Documents section.

Step 3) An Open dialog box will appear on the screen.
Step 4) Locate the file you want to insert from there and press Open.
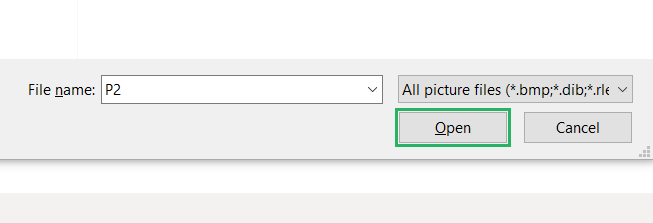
The image will appear in the report. Resize it, crop it – you can manipulate the image as you like.
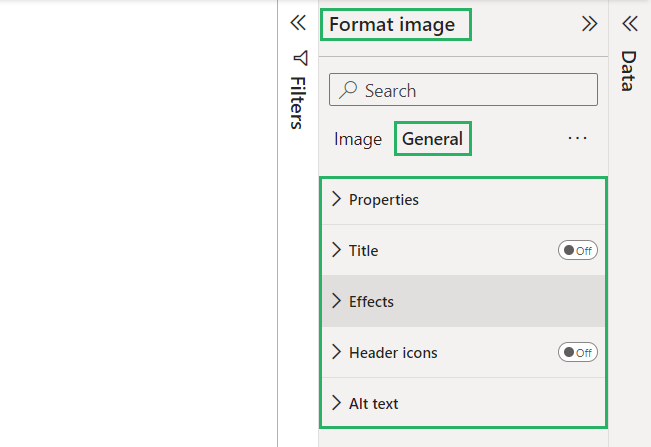
You can also add different elements to the visual from the Format pane.
That wasn’t difficult now, was it? 😉
Adding Image as Background
Sometimes you need to add images as background in your reports to add a little life and color to it. Power BI offers an easy way to insert images in your canvas and wallpaper.
To do that,
Step 1) Select the page or canvas where you want to add the image – a dashed line will appear on its borders.
Step 2) On the Visualizations pane on the right side, click on the Format your report page option – a document with a paintbrush icon 🎨
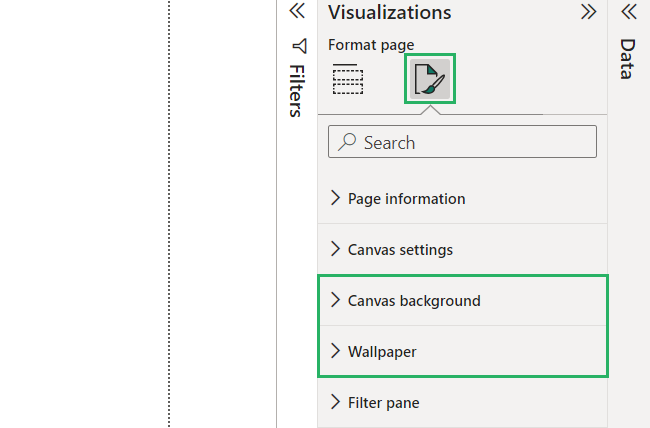
All your options will appear there.
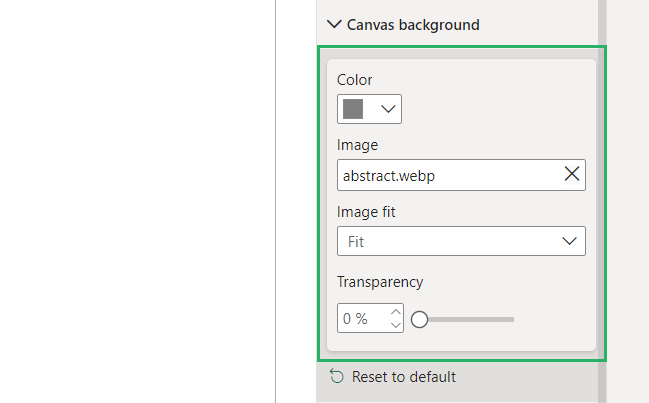
Step 3) Click on Canvas background to open its properties.
Step 4) Browse for an image, reduce the transparency to 0%, and choose the background color of the canvas.
Step 5) You can change the fit of the image on the canvas by clicking on Image Fit.
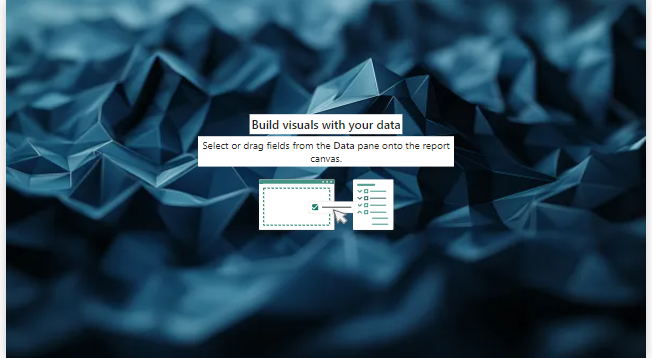
The canvas will look something like this:
Step 6) Now select the Wallpaper option.
Step 7) Choose an image from your computer, and choose the color and size of your image – the transparency should be set at 0% by default.
The final look of the report should be something like:
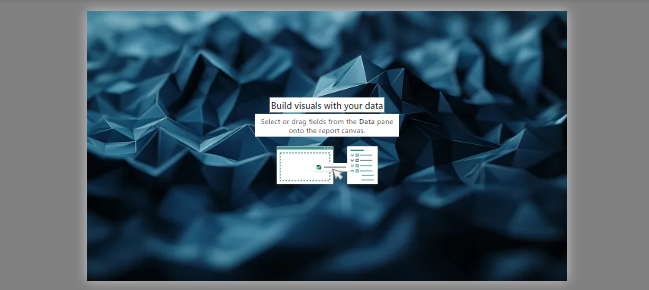
The Power BI report looks much more enhanced than before. How easy was that? 😁
Using dynamic image URLs in Power BI reports
Power BI lets you add images with URLs to your report as well. This is the most useful feature as adding links from other files to display images is a relatively complex process in most software.
Luckily, Power BI offers quick and easy-to-access features that let you add image URLs to your report so you can dynamically access them 😎
It lets you create links to images in your table and you can then display them one by one in your selected visual in the report. The process is as simple as the one above. Let’s see how to do it now.
Prepare Data
To insert image URLs in your report, you need to prepare your data. Let’s see what that entails below.
Step 1) Click on the canvas in the report to activate it.
Step 2) From the Visualizations pane, click on the three horizontal dots.
Step 3) Select the Get more visuals option from the dropdown.
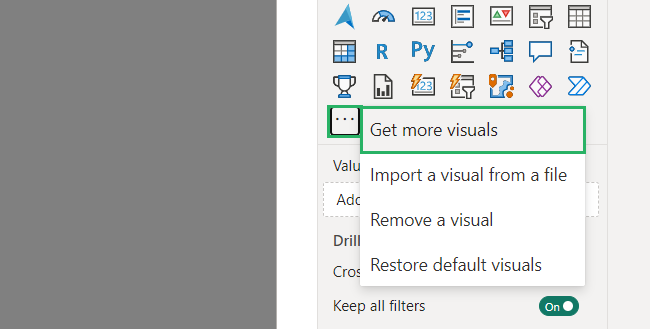
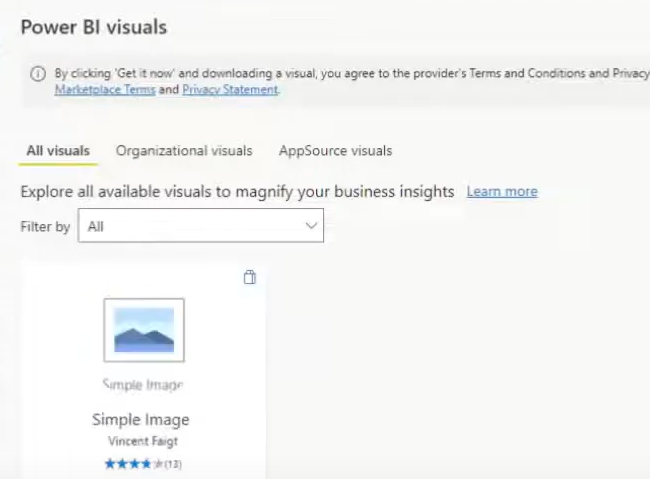
Step 4) It will open the Power BI Visuals window.
Step 5) From the search bar, search for Simple Image and select the first result.
Step 6) Click on the second table-like icon Under the Clipboard section to switch to Table View.
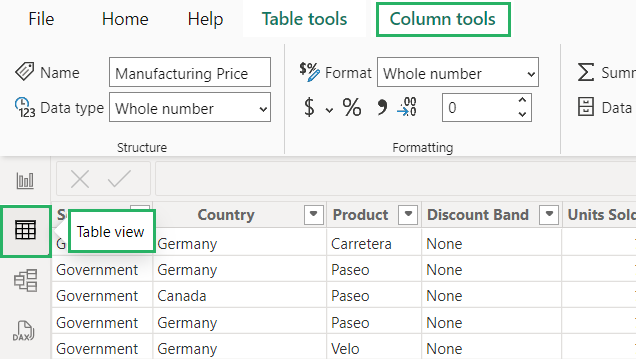
Step 7) Create a separate column for the URLs of your image by selecting New Column from the calculations section on the Table Tools tab.

Step 8) Select the column containing the links.
Step 9) On the Columns Tools, select the Image URL from the Data Category option from the Properties section.
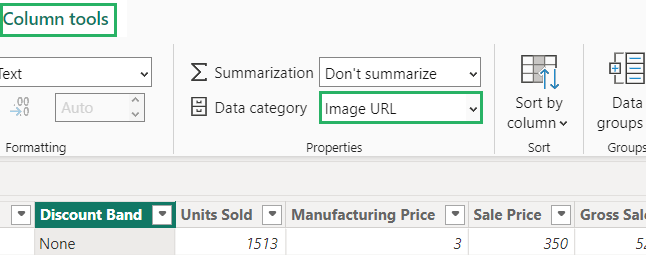
This configuration tells Power BI to consider the column links as Image URLs instead of text.
Once that’s done, move to the next part of inserting image URLS – creating visuals 📸
Create Visuals with Images
To add the images,
Step 1) Insert a card or table visual in your Power BI report.
Step 2) Go to the Visualizations pane on the left side of the screen and select Table or Card 🖼
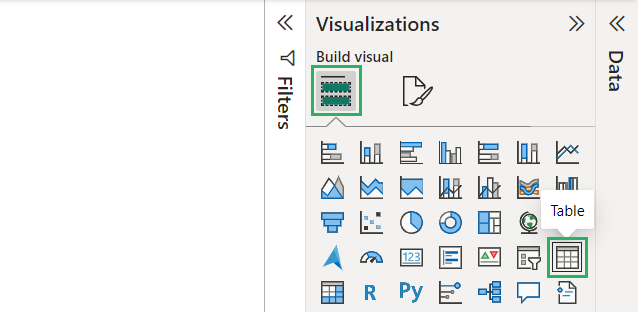
Step 3) Click on the table visual to activate it.
Step 4) Check the column from the Data pane containing image URLs
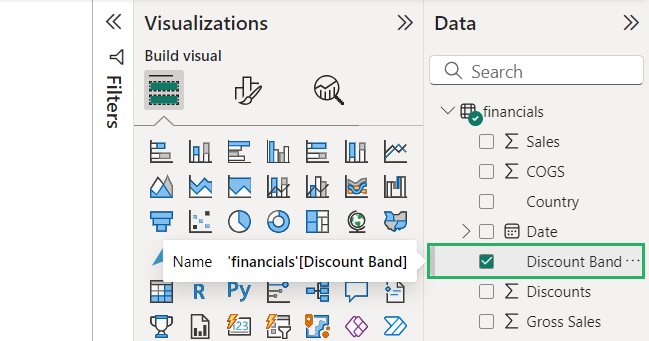
The column with their data will appear in the table.
Step 5) Now select the Simple Image visual from the Build Visual pane in the Visualizations pane.
Step 6) In the Image URL box, select and drag the column containing image URLs.
The images have now been linked to the visual. Clicking on each link from the table will display the image in the selected visual.
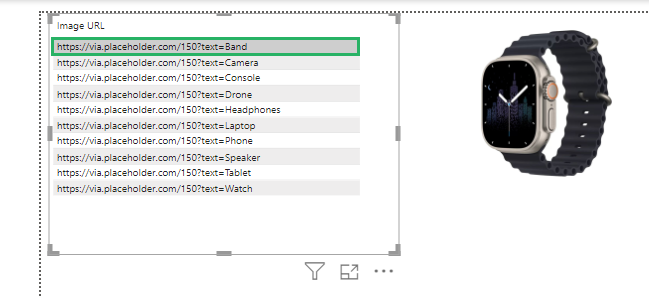
You can modify the width, height, and other properties of the visual via the Format Visual pane.
Step 7) Click on the document with the paintbrush icon in the Visualization pane.
Step 8) Type properties in the search bar.
From the options that appear, you can now change the size, position, etc. easily.
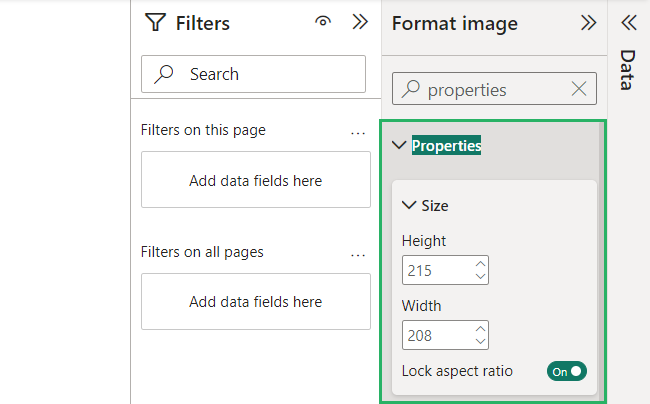
How cool is that? Try it now! 🤠
Conclusion
In this guide, we saw how to add images in Power BI reports and visuals via URLs, and pictures. Adding images to your Power BI reports is a powerful way of conveying your message.
Whether you want to add static images, leverage dynamic content, or simply set a compelling background, Power BI is your go-to software 😃
You can create relatively more engaging, informative, and visually appealing content using Power BI image insertion features.
To learn more about Power BI and its features, give the following articles a read:
How to Create Groups in Power BI: Get an Overview of Your Data
How to Do Table Visualization in Power BI (Step-By-Step)
Power BI Dashboard vs. Report: The Pros and Cons
We hope you enjoyed reading this article as much as we did crafting it! 🤗
